Trapeza Labs Investor Platform: User Guide
The Stock Picker
The Companies Table
The central component of the Stock Picker is the Companies Table (a comprehensive, spreadsheet-like interface). It aggregates and summarizes core data for approximately 900 companies, covering all constituents of both the S&P 500 and the S&P 400 Midcap indices.
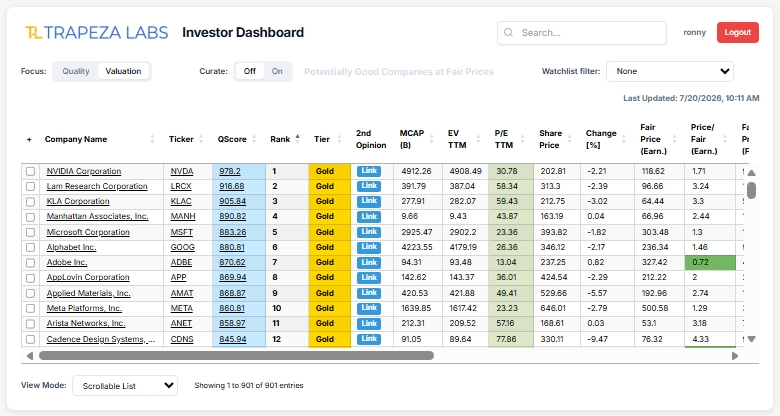
The columns within this table are organized into two primary functional groups:
- General & Quality Analytics: Provides fundamental information and quality summaries, including Company Name, Ticker, QScore, and Rank.
- Valuation & Pricing Metrics: Assists in determining intrinsic value and fair pricing. This section includes metrics such as P/E TTM, P/S TTM, Fair Price (Earn.), Price/Fair (Earn.), and more.
Tip: Hover your mouse cursor over any column header to view a tooltip explaining the underlying methodology and purpose of that specific metric.
Sorting and Navigation
- Default Sort: By default, the table is sorted by QScore in descending order (and Rank in ascending order).
- Custom Sorting: Click any column header to sort the entire table by that metric. Successive clicks will toggle the sorting order between ascending and descending.
- Deep Dive Link: Clicking a company's Name, Ticker, or QScore will automatically direct you to the dedicated Research page for that company (detailed below).
The Focus Toggle
Located directly above the table on the left, the Focus toggle allows you to isolate a company's quality and research metrics from its valuation and market pricing data. Selecting the Quality option automatically dims all columns that are not directly related to qualitative assessment, streamlining your analysis.
The Curate Toggle
Situated next to the Focus toggle, the Curate toggle helps screen for high-quality companies trading at reasonable valuations. Enabling this toggle filters the list to display only companies that meet the following criteria:
- High Quality: A QScore above 600 (out of 1000), placing them in the Gold, Silver, or Bronze tiers.
- Attractive Valuation: A current share price that is either below or slightly above the estimated fair price.
These valuation relationships are tracked in the Price/Fair (Earn.) column and are color-coded for quick scanning:
- Green Background The current share price is below the estimated fair price.
- Yellow Background The current share price is equal to or higher than the fair price, but within a 10% premium.
Important Note: These ratios and color indicators do not constitute financial advice or "buy" recommendations. Instead, they serve as a screening mechanism to highlight high-quality companies that warrant further research.
The Search Field
Located at the top-right of the window, the Search field allows you to quickly locate a specific company by its name or ticker symbol.
- Contextual Filtering: If you are currently viewing a curated list or a custom watchlist, the search function will only look for companies within that active, filtered view rather than the entire database.
The Watchlist Filter
Positioned to the right of the Curate toggle (or below it on narrower screens), the Watchlist selector filters the table to display only the companies you have saved to a specific, named watchlist.
View Mode (Scroll vs. Pagination)
At the bottom of the screen, you can toggle the table layout between a single Scrollable List (default) or a Paged View broken down into numbered pages. The system automatically remembers your selection, saving your preference for future sessions.
Managing Watchlists
A watchlist is a convenient tool for tracking segments of the market—such as companies you want to research further, market "ambush" candidates (waiting for a price drop), or your active portfolio holdings.
Adding Companies to a Watchlist
- Check the box next to the desired company or companies under the
+column. -
A command strip will automatically appear at the bottom of the screen showing the number of selected items and an Add to Watchlist button.
-
Click Add to Watchlist to open a modal window. Here, you can either create a brand-new watchlist or select one or more existing watchlists.
Tip: You can cancel the operation at any time by clicking the X or Cancel button.
Supplemental Data
The "Last Updated" Timestamp
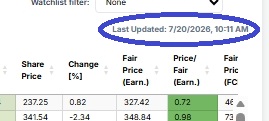
Located above the table on the right, this label displays the exact date and time (adjusted to your local time zone) when the table data was last refreshed.
- Non-Trading Hours: Expect the timestamp to reflect the current morning or the previous evening's close prior to the New York market open.
- Trading Hours: The data refreshes automatically every 30 minutes while the US stock exchanges are open.
Price Charts and External Research (2nd Opinion)
The Trapeza Labs framework focuses purely on fundamental quality and valuation metrics; it does not host standalone historical stock price charts.
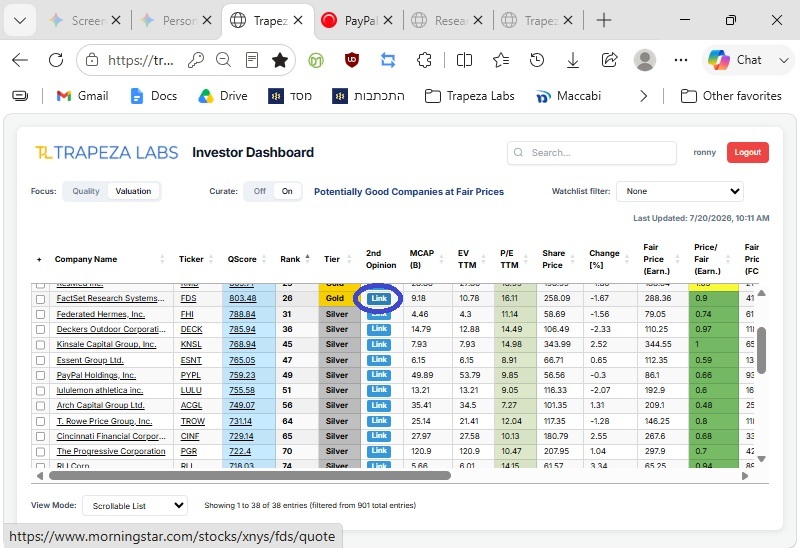
If you want to quickly check historical price charts or seek an independent evaluation, click the Link label in the 2nd Opinion column on any company's row. This will open that company's dedicated profile on Morningstar.com in a new browser tab.
The Research Window
The Research window provides a comprehensive, deep-dive profile of a single selected company. The vast majority of the information hosted here—including scorecards, textual analysis, financial tables, and performance charts—focuses on the fundamental quality of the underlying business to help you make highly informed investment decisions.
Opening the Research Window
To launch the Research window, click a company's Name, Ticker, or QScore from the table.
- Session Behavior: The first time you open a research profile during a session, it will launch in a new browser tab. Subsequent clicks on other companies will reuse that existing tab, refreshing it instantly with the newly selected company's data.
- Navigation Shortcuts:
- Clicking the Name or Ticker opens the window while preserving your last active view mode (e.g., if you were looking at the Charts view, it stays on Charts).
- Clicking the QScore link forces the Research window to open directly to the QScore view, regardless of your previous view.

Available Views
You can easily toggle between five specific data views within the Research window:
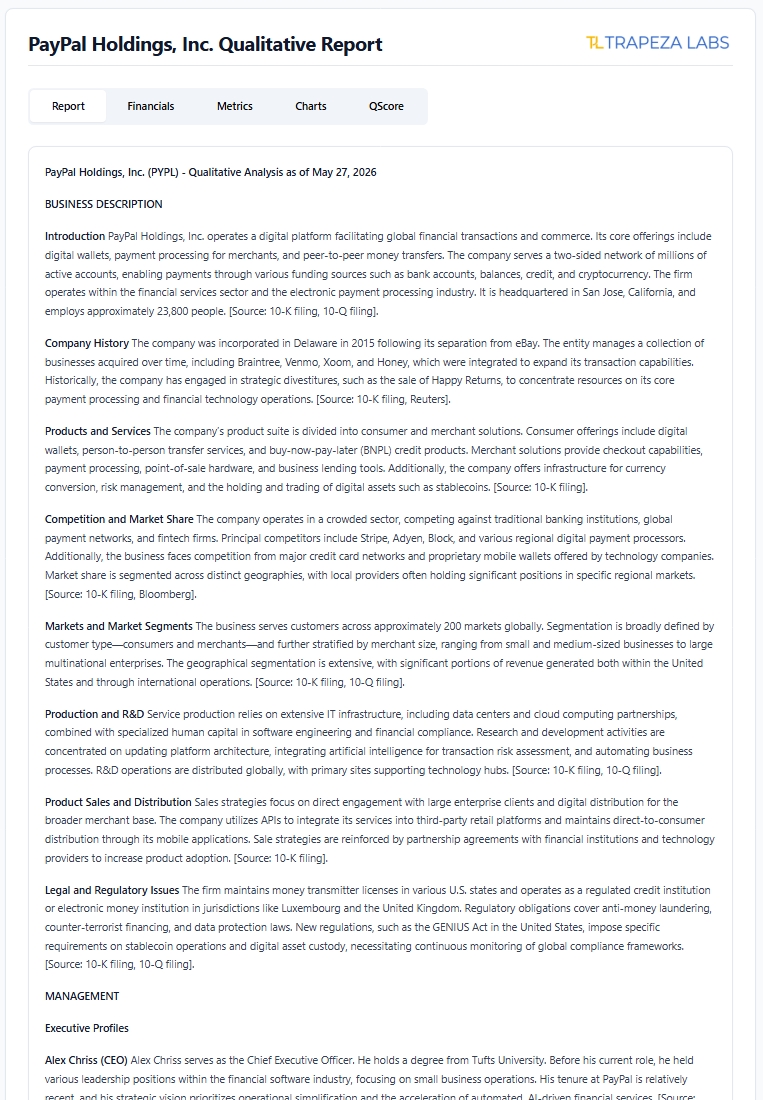
1. The Report View
Features a concise, comprehensive text narrative generated by a Large Language Model (LLM). The report is strictly grounded in the company's two most recent SEC filings (10-Q and 10-K) along with trusted financial news sources (e.g., The Wall Street Journal). It refreshes quarterly following official SEC submissions.
The report summarizes:
- Core business operations, history, and incorporation details.
- Products, services, target markets, and competitive landscapes.
- Research and production facilities, alongside sales and distribution channels.
- Management organization and personnel (including executive compensation philosophy).
- A structured SWOT analysis (Strengths, Weaknesses, Opportunities, Threats).
- Regulatory, and Legal updates.
- Major headlines.
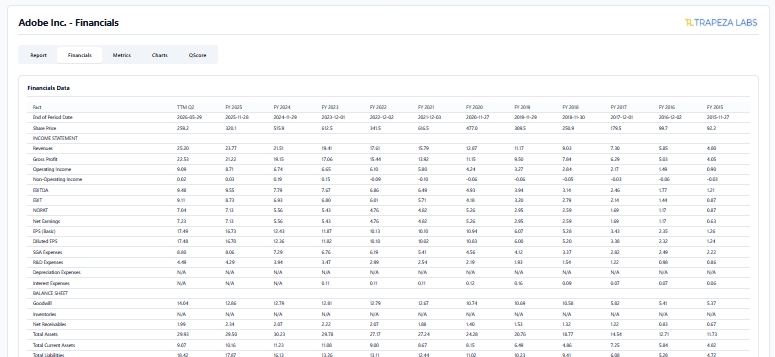
2. The Financials View
Displays a 10-year historical table of raw financial data gathered programmatically by the Trapeza Labs framework directly from official filings on the SEC EDGAR system. No AI is involved in gathering or displaying this data. This clean quantitative data feeds the core analytics engine to calculate financial statistics and the final QScore.
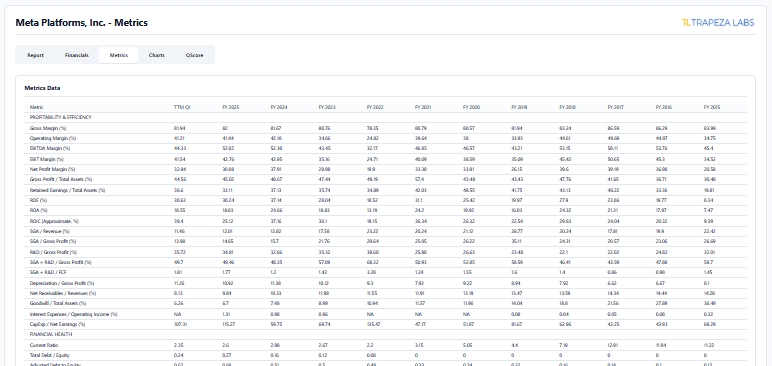
3. The Metrics View
Provides a derived data table calculated directly from the raw financials. It tracks long-term performance trends over a 10-year period, featuring metrics like Gross Margin, Return on Equity (ROE), and Free Cash Flow (FCF) Margin. It also includes selective year-end valuation metrics such as historical P/E and P/S baselines.
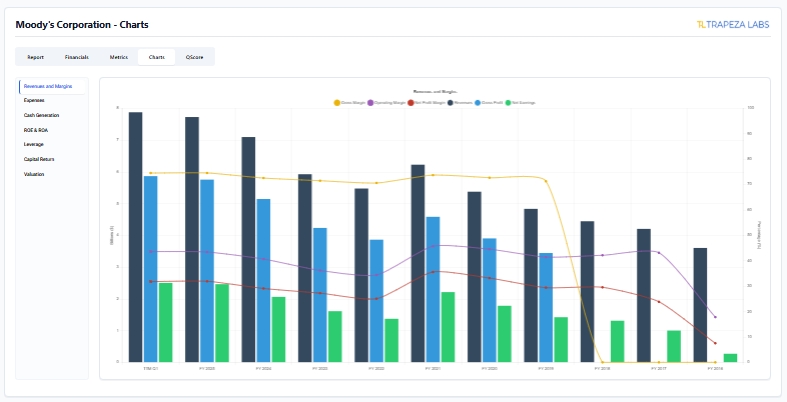
4. The Charts View
Offers visual, graphic representations of historical financial trends divided into key categories: Revenues and Margins, Expenses, Cash Generation, ROE and ROA, Leverage, Capital Return, and Valuation.
5. The QScore View
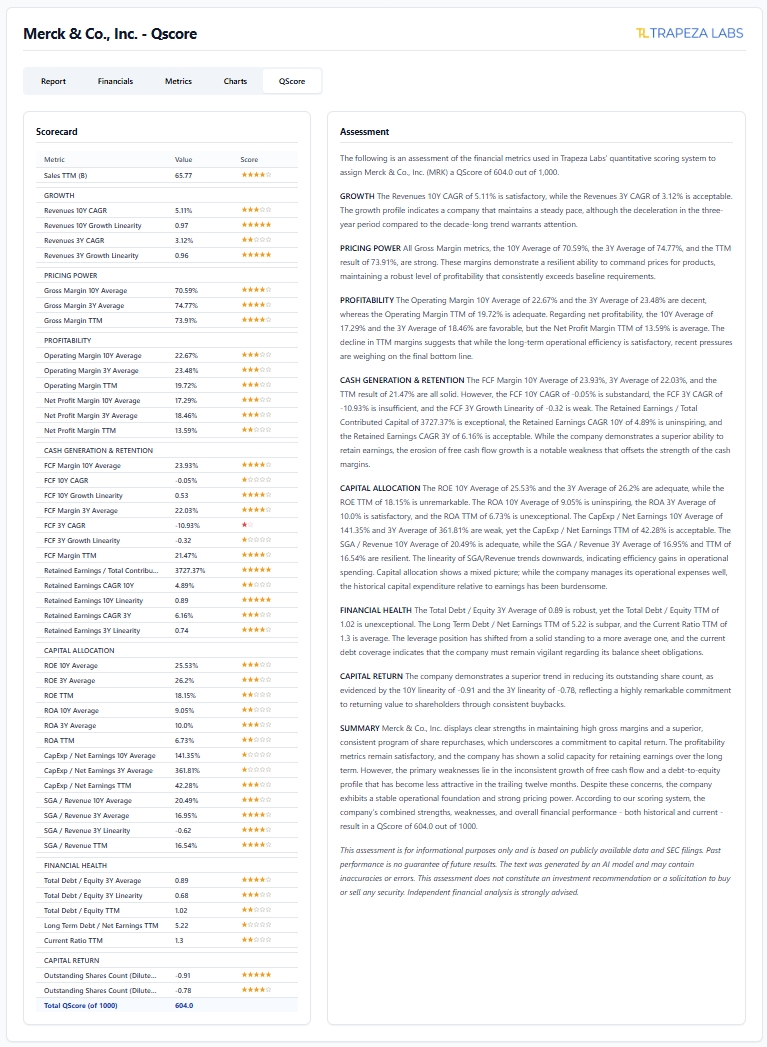
Houses the underlying scorecard detailing the 40+ quantitative metrics used to compute the Trapeza Labs Quality Score. Each metric displays its calculated value alongside an algorithmic star rating that operates on a defined range:
- 5 Gold Stars (The Highest Extreme): Awarded for an outstanding fundamental result.
- 2 Red Stars (The Lowest Extreme): Marks a critical red flag, which typically triggers an automated reset of the company's total QScore to zero.
Textual Assessment: Adjacent to (or below, on mobile layouts) the scorecard is an LLM-generated narrative analysis. It is critical to note that the scorecard itself is entirely AI-free; its data, metrics, and star ratings are derived purely through deterministic, mathematical algorithms executed by the core Trapeza Labs framework. This LLM narrative companion exists solely to translate those dry, strictly objective figures into an easy-to-read qualitative synthesis.
Desktop Optimization: Split-Screen View
For the most efficient workflow, we highly recommend utilizing the native split-screen feature built into modern desktop web browsers.
By positioning the main Trapeza Labs Stock Picker window on one side of your screen (e.g., the left) and the Research window on the other side (e.g., the right), you can comfortably scroll through your companies table and see the deep-dive research panel update instantly upon every selection.